“Graphic organizers, graphic organizers, blah blah blah” about sums up what I used to hear when a professor talked about how important graphic organizers are for teaching English Language Learners (ELLs). You see, I’ve had to get my ESL endorsement in two different states, so I’ve sat through quite a few of those classes. Anyway, I believed my professors and incorporated graphic organizers into my teaching. But I didn’t realize why, exactly, they were so awesome, until this summer…when a professor put it this way: “Graphic organizers are great for ELLs because they allow them to express higher order thinking without being limited by the language they can produce.” Brilliant, and so true. For example, creating webs often requires students to classify and sort, Venn diagrams require comparisons and contrast, etc. Using these graphic organizers allows ELLs to do that thinking but not get bogged down by language.
All of my kids are ELLs, since I teach bilingual kindergarten. However, even when we’re working in their native language (Spanish), I still think graphic organizers are great. Since they’re only 5 and many come to school with somewhat limited language experiences, their abilities to express complex thoughts can sometimes be limited. So I’ve vowed to use graphic organizers more often.
I’ve started off the year with some simple graphic organizers to teach reading comprehension. I wouldn’t say that they’re very complex, but it’s a start. So far I’ve used webs and t-charts for teaching kids how to make predictions before reading a book.
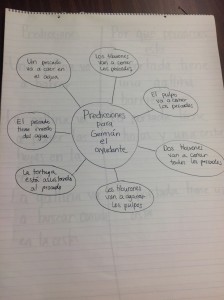
Here’s a picture of a web (the first organizer I used when asking them to make predictions):
Sorry that it’s in Spanish and sorry you can kind of see through to the chart paper behind it! Anyway, what it says in the middle is “Predictions for ________” (fill in the blank with the book we read). Every time a kid made a prediction, I put it in a different circle off the web. Afterward, we went through and circled any predictions that were correct (talking, of course, about how the correctness was not necessarily important, and that the act of making the predictions was what prepared us to better understand the story).
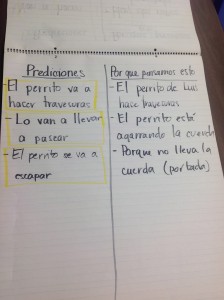
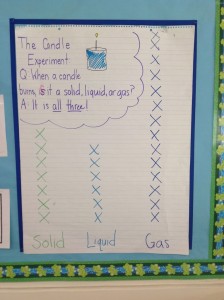
Here’s a T-chart (this came a day or two after we used webs to make predictions):
